

The Client and Context: Supply Chain Visibility for One of the Largest Pharma Companies
The client is one of the largest pharmaceutical companies in the world with a presence in over 125 countries. In India the company has a 70-year-old legacy of clinical development with a portfolio of over 150 products across 15 therapeutic areas. It produces a massive 7500 tablets every minute and serves India, Nepal and Sri Lankan markets through its manufacturing units in the country.
Given the enormity of its market, clear visibility of each element of its supply chain was essential for the company. However, the clarity and access to the right information at the right time was lost in a complex web data on vendors, distributors, inventory, logistics and more. Business functions were struggling with clear view of required information for informed decision making.
MResult created a streamlined system and a dynamic dashboard that helped in complete visibility across the supply chain leading to cost efficiency and revenue gain.
Challenges: When Too Much Information Yields Too Little Visibility
The client had close to a 1000 SKUs distributed across India, Nepal and Sri Lanka through hundreds of vendors. Managing inventory, ensuring timely logistics and minimizing write offs for expiring medicines causing revenue loss was becoming increasingly difficult.
Some of the challenges in supply chain operations included:
Enormous Data, Suboptimal Management
- Manual Processes: Manual data processing and reporting was time-consuming and prone to errors escalating operational costs. It took up to 15 days to generate simple reports, delaying decision-making that impacted revenue as well.
- Scattered Data: Data related to revenue, inventory, returns, and forecasts were scattered across different systems. Each function was preparing its own report making it difficult to consolidate and analyse at scale and speed. This left limited scope for leadership to take informed and timely decisions.
Limited Visibility, Obscure Insights
- Limited Visibility on Sales Data: The distributed nature of sales data made it difficult to get a clear sight on budgeted vs actual sales. This also hindered accurate forecasts, making future planning difficult. The leadership could not get right insight on current or future pipeline and issues causing ebb or surge in sales in specific markets or products.
- Lack of Comprehensive View: There was no single platform to provide a holistic view of the entire supply chain performance. This limited the ability to track key performance indicators (KPIs) for different operations effectively.
- Inadequate Performance Tracking: The client needed to continuously monitor performance, for different teams involved in entire operation, varied customers across the market as well as multiple products and a thousand plus SKUs., Getting granular-level insights was challenging, hindering the ability to identify and address issues promptly.
Large Inventory, Glaring Blind Spots
- Inventory Aging: Managing inventory aging was difficult, leading to increased write-offs and inefficiencies in inventory turnover.
- Returns Handling: Lack of timely and multidimensional insights impacted the process for managing saleable and non-saleable returns, affecting intelligent product distribution and increasing waste.
- Vendor Management: Limited visibility on the right data hindered effective analysis of vendor performance, making it hard to identify sporadic or consistent underperforming vendors and address related issues.
Solution: Dynamic Dashboards for Granular Visibility and Automated Analytics
MResult team addressed the challenges of visibility across supply chain operations and analytics on the go with a custom Tableau implementation, configuring complex logic at the backend for streamlined decision making for business leaders. The users could get quick high-level perspectives or dig deep for granular level insights to meet their specific requirements. This significantly improved decision-making, cost savings, and enhanced efficiency in operations across the lifecycle. Here’s a snapshot of solution design and architecture:
- Data Architecture and Design: Given the huge amount and high complexity of data, MResult team designed and defined a specific data layer at source. This ensured streamlined data pipeline. Data was prepared and transformed before designing visualizations. The team took a phased approach to process data for better performance. The robust architecture was designed to deal with future complexities, having provision for easy scalability, security and access.
- Dynamic Visualization and Standardized Reporting: MResult team used Tableau as the visualization tool to provide custom dashboards. The solution included configuring extensive logic for different KPIs and performance bands, enabling standardized reports across operations. The dashboard provided dynamic views for every stream of data and provided required insights for leadership.
- Historic Analysis and Forecasting: The data architecture provided access to past information across KPIs along with current data. This enabled leadership to do trend analysis, compare performance for different markets, vendors, products and more leading to better decision making. The SKU level deep dive allowed for better forecasting in terms of inventory management, sellable and non-sellable products and those hitting expiry, reducing wastage and boosting revenue.
- Performance Management and Scalability: MResult team designed the solution with future scalability in mind. The Tableau integration was designed to manage robust data pipeline at scale. The reports were generated in matter of minutes instead of weeks. The data would refresh in less than 7 seconds for immediate view and analytics, despite the volume and complexity. This ensured optimal operations and higher productivity for client teams.
- Automation and Augmentation: The solution design eliminated manual effort by automating the entire process from data ingestion to reporting and analysis. The error free data pipeline elevated trust and removed anomalies in reporting. The performance was augmented with self-serve and ad hoc reporting capabilities, aligned to each role with required governance in place.
Benefits Beyond Brief: Cost Efficiency, Revenue Boost and Stellar Performance
Faster Processing, Timely Insights:
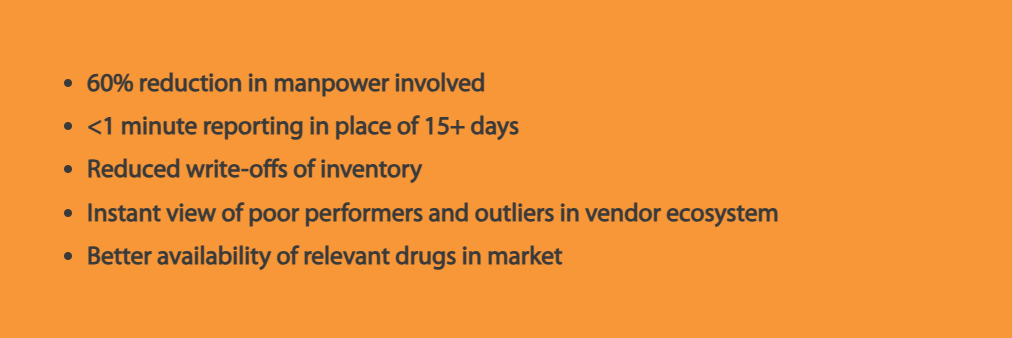
- The time required to process data and generate reports was reduced from 15 days to within an hour. This significant improvement in turnaround time was a clear indicator of increased efficiency.
- By automating data processing and reporting, the client reduced manpower requirements by 40-60%. This reduction in manual effort translated into substantial cost savings.
- The reduction in write-offs due to better inventory management was a critical measure of success. By prioritizing the sale of short-term expiry products, the client minimized losses and improved inventory turnover.
- The enhanced accuracy and reliability of data, with near-zero margin of error, were crucial for decision-making. This improvement in data credibility was a significant success factor.
Sales and Revenue Tracking:
- Improved tracking of sales and revenue at the product and SKU levels allowed the client to identify high-performing and underperforming products. This led to more targeted sales strategies and better financial planning.
- The ability to analyze vendor performance and address issues with underperforming vendors was another measure of success. This helped in strengthening relationships with high-performing vendors and improving overall supply chain efficiency. In some cases, the client was surprised to see its perception of certain vendors challenged with the detailed view at hand leading to radical changes in vendor management for better outcomes.
User Engagement and Satisfaction:
- The leadership team’s ability to connect the dots between sales, inventory, and forecasts more effectively was a measure of the dashboard’s success. The positive feedback and increased engagement from the team indicated high user satisfaction.
- The dashboard’s capability to provide future predictions and trend analysis enabled better forecasting and strategic planning. This forward-looking approach was a key measure of the dashboard’s effectiveness.